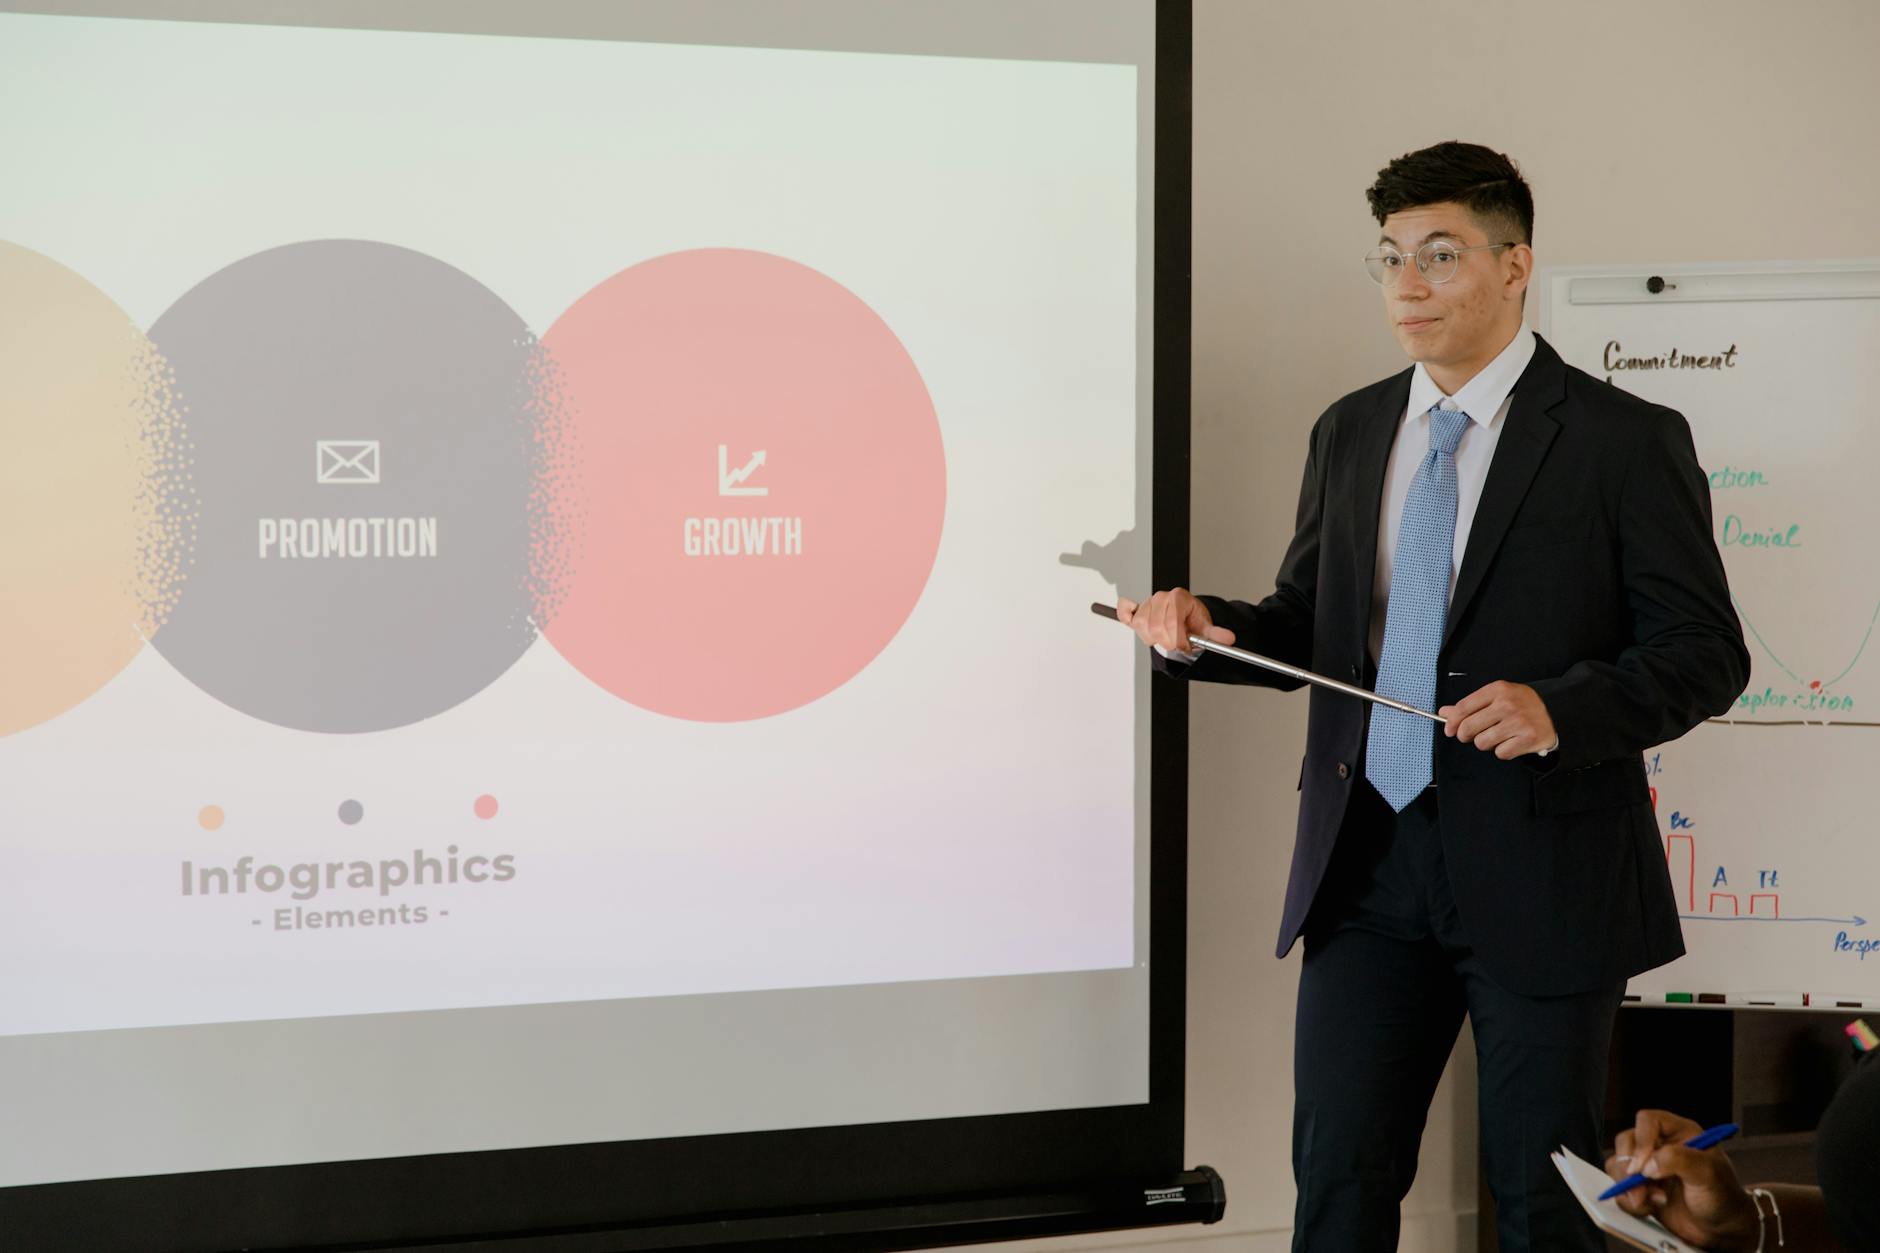
A PESTLE analysis can surface important forces shaping a market, project, or organization. But a list of political, economic, social, technological, legal, and environmental factors is not yet a strategy. An effective presentation shows which forces matter, why they matter now, and what decisions they should inform.
To make that shift, move from scanning to interpretation: select the evidence that changes your outlook, explain its potential impact, and connect it to choices the audience can act on. The result is a PESTLE analysis presentation that supports a decision rather than simply documenting research.
Start with the decision the presentation needs to support
Before arranging factors into six categories, define the question your audience needs to answer. It might be whether to enter a market, adjust a product launch, change a supplier, or revisit a three-year plan. A specific decision gives the analysis a useful boundary: it helps you decide which external forces belong in the presentation and which can stay in the background research.
Then identify the audience and the decision they can make. A leadership team may need to approve investment or set risk tolerance; a marketing team may need to adapt positioning or channel plans. Write a one-sentence objective, such as, “Decide whether to proceed with the launch this year and what conditions would change that recommendation.” Use it to test every slide.
Gather evidence and separate signals from assumptions
Collect relevant information for each PESTLE category, but do not treat every observation as equally reliable or consequential. Record the source, date, geography, and any important caveat alongside each finding. A proposed regulation, for example, is not the same as an enacted rule; a broad consumer trend may not apply to the specific segment you serve.
Separate evidence from interpretation. “A new packaging rule is scheduled to take effect next year” is a finding; “our current packaging may need redesign” is a business implication. Label uncertain claims as assumptions or scenarios instead of presenting them as settled facts. This makes it easier for the audience to challenge the reasoning without losing sight of what is known.
If your research is spread across documents, reports, or web pages, organize those source materials before building slides. Pekto can turn source content into editable presentations, which you can review and refine. For a report-led workflow, see Report to Presentation AI or the AI Presentation Maker.
Prioritize the factors that could change a decision
A useful presentation is selective. For each factor, assess its likely impact on the decision and how soon it could affect the organization. You can use a simple high, medium, or low rating, provided you define what each level means. For example, “high impact” might mean the factor could make the launch unviable, require material investment, or change the target customer.
Consider uncertainty as well as impact. A highly consequential but uncertain development may call for scenario planning or a contingency; a predictable, lower-impact change may only need monitoring. Avoid implying that a score is objective precision. If stakeholders disagree about an assessment, show the disagreement and explain what evidence would resolve it.
A practical filter is to keep a factor in the main story if it changes a choice, creates a meaningful risk or opportunity, or requires a response before the next review. Put useful but non-urgent context in an appendix. This keeps the presentation focused without pretending that lower-priority forces do not exist.
Translate each important factor into a strategic implication
For every priority factor, explain the chain from external change to business consequence. A clear pattern is: what is changing, which part of the organization is exposed, what the effect could be, and what response is available. For instance, a rise in shipping costs may affect product margin; possible responses could include repricing, changing fulfillment arrangements, or narrowing the launch assortment.
Use concrete, bounded language. “Technology is changing rapidly” does not tell the audience what to do. “Customers are adopting self-service tools, so the onboarding plan may need stronger digital support” connects a trend to an operational choice. If the effect depends on an unknown, state the condition: “If the draft rule is enacted in its current form, redesign may be required before the next production cycle.”
Connect factors across categories when they reinforce one another. New environmental rules may create legal requirements, while customer expectations influence the commercial value of complying early. Showing that relationship can reveal a strategic issue that would be easy to miss in six disconnected lists.
Build a slide sequence that leads to a recommendation
Organize the deck around the decision, not the order in which research was collected. A useful sequence is: decision and scope; key takeaway; prioritized external forces; implications for the organization; strategic options; recommendation and next steps. A six-part overview can help orient the audience, but it should not force you to give every PESTLE category the same number of slides.
Give each slide one job. A factor slide might use a short headline, a small amount of supporting evidence, an impact statement, and the decision or response it raises. Use a chart when it clarifies a trend or comparison; use a labeled diagram when showing relationships. Keep caveats close to the claims they qualify, and move detailed source notes or secondary findings to an appendix.
Make the recommendation visible before the closing slide, then use the final section to specify owners, timing, and trigger points. For example, a team might proceed with a launch while monitoring a regulatory milestone, with a named owner responsible for returning to leadership if the rule changes. A presentation storyline generator can help shape an initial sequence, but the final narrative should reflect your evidence and audience.
Review the deck for clarity, balance, and actionability
Check that the presentation distinguishes facts, assumptions, and recommendations. Verify dates and sources, especially for fast-moving legal, political, or economic developments. Ask whether a reader could understand the takeaway from slide headlines alone, and whether the supporting details actually justify the conclusion. If a headline makes a strong claim, the evidence should be easy to find on that slide.
Look for common weaknesses: six equal sections that hide the most important issue, a long list of trends with no implications, a recommendation that appears without showing its rationale, or risk ratings with no defined scale. Also check that environmental and social factors are treated as relevant business context rather than added only for completeness.
Finally, ask a colleague unfamiliar with the research to explain the decision, the main reasons behind it, and what happens next. If they cannot, simplify the story or make the links between evidence and action more explicit. Pekto outputs are editable, so you can review and adjust generated content and structure before export; Presentation Templates can also provide a starting point for organizing a deck.